
Wealth and Inequality in India
Wealth and Inequality in India
Scan with
wechat to share

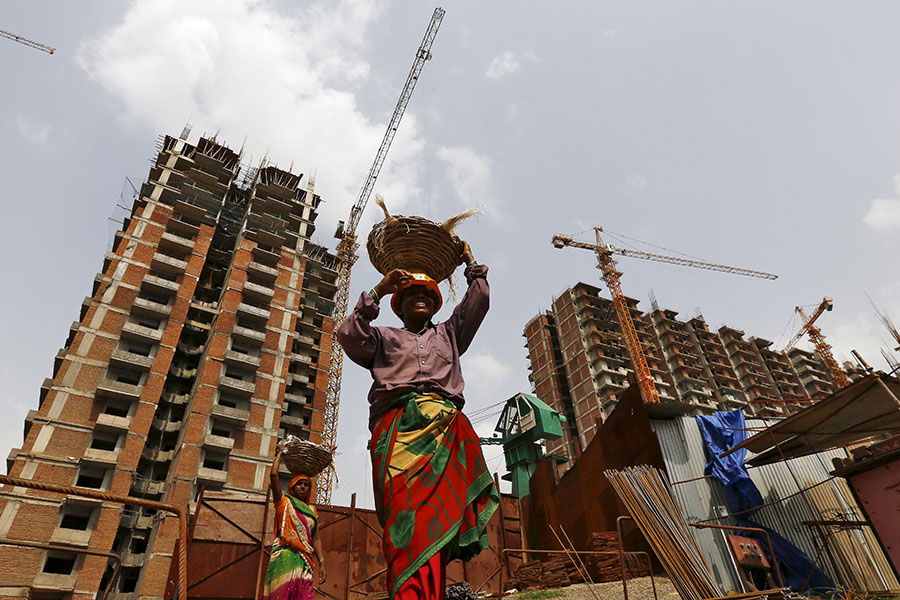
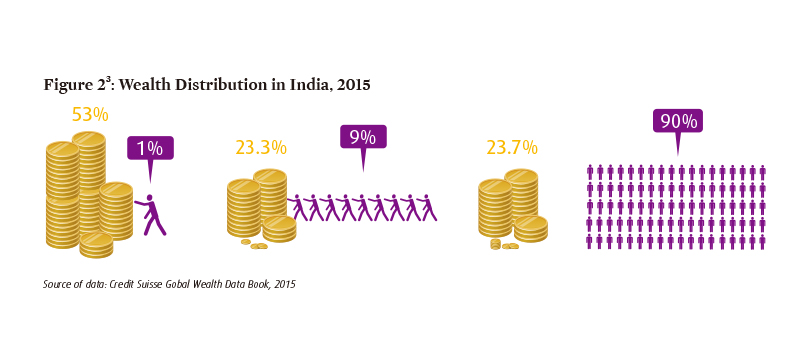
India is currently becoming one of the most unequal regions in the world. According to Credit Suisse Global Wealth Data Book 20151, the top 1 percent of the Indian population own more than half, i.e., the 53 percent of the total private wealth in country (See Figure 1).
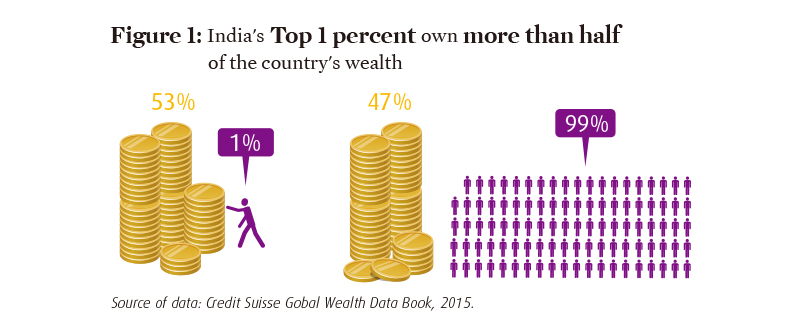
Among all the regions, India’s richest 1 percent own the largest share of their region’s wealth. For comparison across regions the Data Book divides the world into seven different groups –Europe, North America, Latin America, Africa, Asia-Pacific, China and India (See Table 1). Considering the large populations in these two countries, China and India were accorded the status of two different regions.
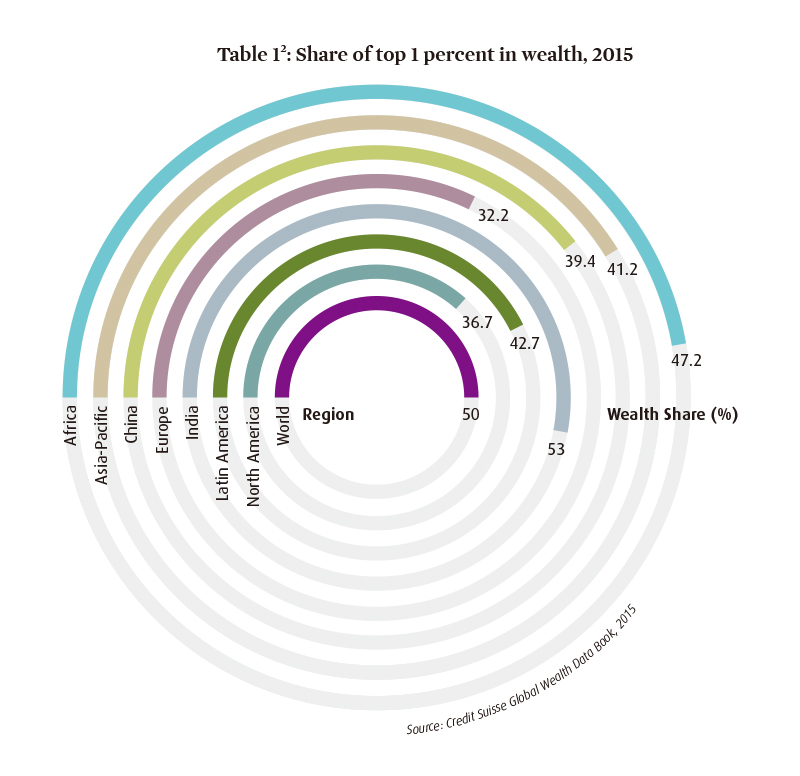
If we take a closer look at India’s wealth distribution, the poorest own very little of the country’s wealth. All the wealth of the bottom 50 percent of the population, i.e 625 million of people, is just about 4 percent of the total wealth. The bottom 90 percent of the population put together have less than a quarter of total wealth, as the top 10 percent appropriated 76 percent of the total wealth (See Table 2 & Figure 2).
The starkness of India’s wealth inequality is such that, today Mukesh Ambani, the richest man in India, owns more wealth than the combined wealth of the bottom 20 percent of the population (250 million). Fifteen richest Indians own more wealth than the bottom 50 percent of the population and hundred richest Indians own more wealth than the bottom 70 percent of the population4.
India’s wealth distribution was not always of such extreme inequality. In the year 2000 the share of India’s top 1 percent was 36.8 percent. India’s situation was better compared to the world, where the top 1 percent population owned 48.7 percent of the total world wealth. Now, after 15 years, while the share of the world’s top 1 percent in world’s wealth increased by 1.3 percentage points, the share of India’s top 1 percent increased by a whopping 16.2 percentage points5.
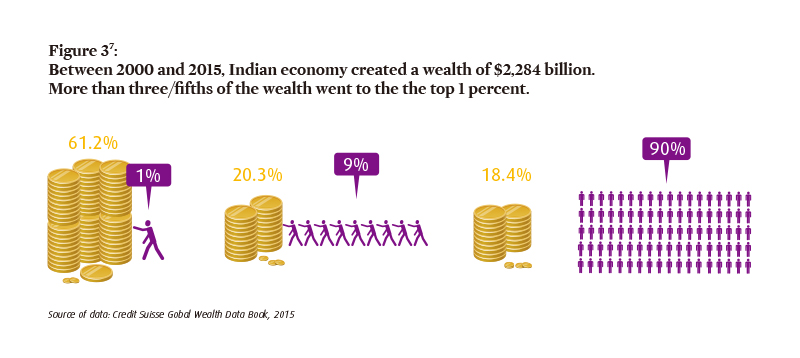
The Credit Suisse data also shows that, economic growth in India largely benefited the top 1 percent. A total wealth of $ 2.3 trillion was created in the Indian economy between the years 2000 and 2015. Out of this newly created wealth, the top 1 percent appropriated 61 percent ($1.4 trillion), while the next 9 percent got 21 percent share ($ 0.5 trillion). The bottom 90 percent of the population was left with only 18 percent ($0.4 trillion) of this new wealth6 (see Figure 3).
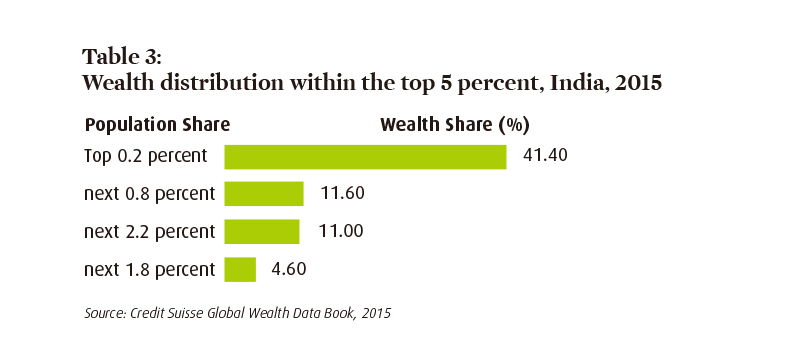
Even among the top 1 percent which is about 12.5 millions of people (India’s population is 1.25 billion), it is really a handful at the top that benefited from the growth, as can be seen by the fact that the top 0.2 percent of the India’ population, i.e., ‘one fifth of the top 1 percent’ own more than 40 percent of the country’s wealth (See Table 3).
The Credit Suisse data also shows that the so-called thriving middle class in India in fact is a very small section of the population. The data book places a meager 3 percent of India’s population in the middle class8, i.e, only 37.5 million people out of 1.25 billion Indian population belongs to the middle class. Middle class and the rich9 together constitute just 3.2 percent of the total population, leaving almost 97 percent of the population below the level of middle class.
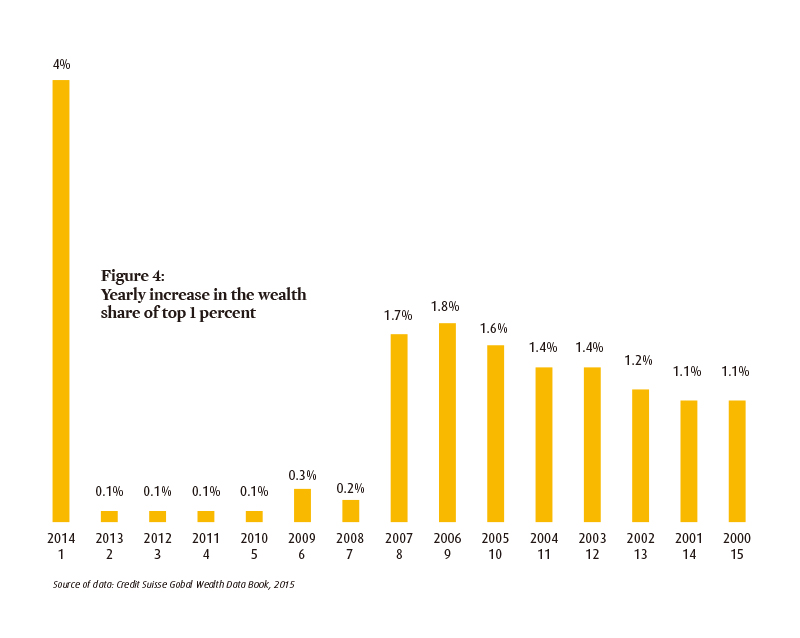
While the growth in inequalities has been low in India, during the UPA II period, the first year of the Modi government showed a sharp growth in inequality. The share of the top 1 percent has risen by about 4 percent points in just one year alone, much higher than anything we have witnessed from 2000 onwards (See Figure 4).
It is obvious that the policy path followed by successive Indian governments has contributed to growing inequalities. If the rate at which the top 1 percent has been eating up the wealth pie - an increase of one percentage point every year - in another 12 years, their share in India’s wealth is likely to go up to 75 percent. What we are seeing is actually a trickle up effect, rather than ‘trickle down’ as some economists claim would happen with the expansion of the economy.
Prabir Purkayastha is the chairperson of the Knowledge Commons and founder-editor of the Newsclick, an online news portal.
Bodapati Srujana is a researcher in the Knowledge Commons, working on issues in digital economy and on inequalities in India.
1: Source: http://publications.credit-suisse.com/tasks/render/file/index.cfm?fileid=C26E3824-E868-56E0-CCA04D4BB9B9ADD5
2: This data is reproduced from the Credit Suisse Global Wealth Data Book, 2015. All the shares do not exactly add up to 100%, likely due to rounding off to the first decimal.
3: The data here is reproduced from the Credit Suisse Global Wealth Data Book, 2015. All the shares do not exactly add up to 100%, likely due to rounding off to the first decimal.
4: To make these comparisons, net worth data from Forbes list of India’s 100 richest has been used, along with http://www.forbes.com/india-billionaires/list/#tab:overall
5: These calculation were made using data from Credit Suisse Wealth Data Book for year 2014 and 2015.
6: The calculations on wealth growth were made using wealth data at constant exchanges rates, taken from Credit Suisse Wealth Data Book, for years 2014 and 2015.
7: The shares in this pie chart do not exactly add up to 100%, due to rounding off to the first decimal.
8: Credit Suisse has defined middle class (India) as those who have a net worth between $13,700 and $ 137,000 approximately.
9: Rich (India) are defined as those with more than $ 137,000 in net worth.